(ATF) In times like this, it is easy to forget that volatility is a necessary part of a healthy market. In fact, it can be used to reconfigure portfolios to operate more efficiently for the coming years.
Volatile conditions currently in the market started in 2019 amidst a trade war, Brexit and a slew of other geopolitical tug-o-wars. These created an opportunity for investors to re-assess and diversify. The US market in particular had been increasingly correlated across asset classes over the last decade. Politics and in particular the US election took over the new cycle but even in the midst of these catalysts of turbulence the bull market pushed through like a juggernaut, barely chipped by anything that would typically create at least a moderate pullback.
And then 2020 came like a giant balloon popping. Covid-19 brought with it a wave of volatility that started in China pushing the CSI300 down in January and again in March. The wave continued into other parts of Asia and then Europe and the US. Although the S&P500 has recovered most of what it lost (~33% from peak in February) with the Covid-19 containment still in process, there will be more volatility to come.
But, volatility, again, can be good if approached strategically. This is easier to say during bull markets when volatility is benign, but in times where volatility begins to chip away at investment portfolios this statement becomes hard to stomach.
Volatility tells us the health of the market in several ways, including:
# It gives us a means of measuring the relationship between those who want to buy the market and those who want to sell it;
# It gives us a benchmark for how much we need to spend to protect against large moves in the market;
# and most important when building a diversified portfolio, volatility gives a means to measure the relative risk across asset classes and markets.
Can volatility be used to time market entrance?
Now, as we all are in the midst of market turbulence and all portfolios have seen some nicks and cracks forming because of the rollercoaster, the questions on every investors minds are a) Have we hit the bottom? And b) How long will the recovery take?
Basically, when is the right time to get into the market. And the answer is: Now, and also yesterday and also tomorrow.
In fact the real question we want to be asking is: “How do I get back in the market?” or “How do I reallocate now?”
First, let’s quickly look at a timing exercise. Figure 1 shows the S&P500 during the 2008 Global Financial Crisis (GFC). Graphed in the chart below are three data series, all 90 days before and 90 days after the bottom of the market during the GFC. On the right axis we have the S&P500 and the VIX during that 180-day period. The series graphed relative to the left axis is the total cumulative return generated from the start of the day on the x-axis to March 9, 2019 (10 years later +/-1 the offset).
There are two features that are worthy of note: (1) most of the cumulative returns generated averages to slightly over 200% – meaning it didn’t matter when you invested during that 180-day period if your target return after 10 years was above 200% (~7% annualised return) and (2) if our timing of the bottom of the market was off by more than +/- 1 week, our return potentially dropped by 50%! – in fact we needed to be within one day to hit the 300% mark.
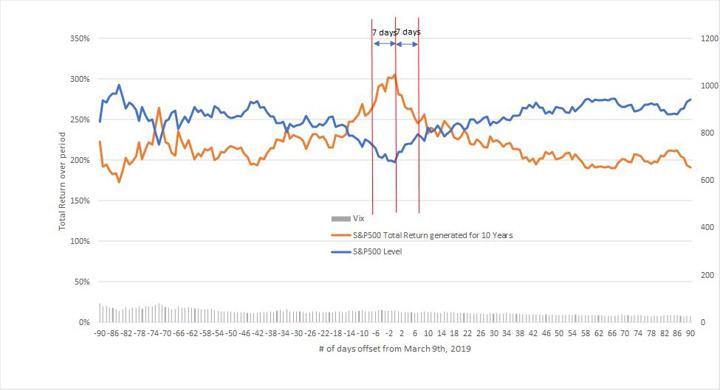
Figure 1
How do we flatten the timing window?
Looking at a chart as we have in Figure 1, one can be tempted to try hitting the bullseye of the timing window. However, in practice this is extremely difficult, as the window is small and difficult to determine in the moment. A better and more efficient solution comes from flattening the timing window; which corresponds to effectively exchanging the amplitude of the peak for heightened plateaus around the peak (in Figure 1). This basically lets the mountain flatten into the surrounding land, one could say. It can be done in a number of ways, but one of the methods most effective is by adding an overlay to the equity position which diversifies the market risk concentration.
To illustrate this method we build an overlay strategy that is composed of only alpha components of the market. Put simply, these components target only the alpha generators of the market which are designed to be less correlated with the broader market. Figure 2 shows the strategy’s 10-year cumulative return if invested in the 180 day window we saw in Figure 1.
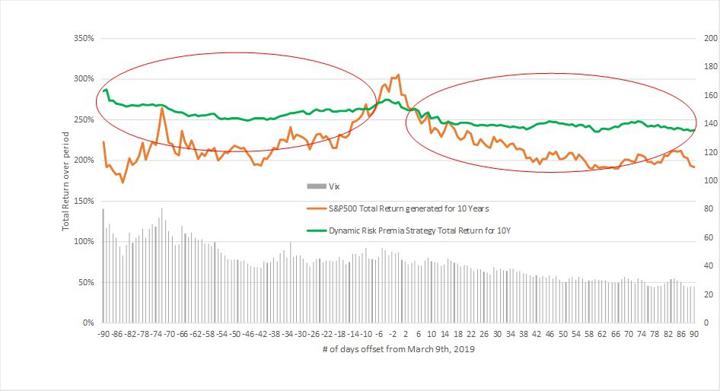
Figure 2
Looking outside the “bullseye” window, we can see that by adding the dynamic alpha strategy we can raise the plateau and make timing less important. Simply put, this method works because instead of just one timing window by diversifying the exposure to market factors (via the alpha strategy) we have effectively put together a series of timing windows which spread over a longer temporal region.
Conclusion
There is no question, the timing of investment in the right asset class can bring significant gains. However, the margin for error is so small that finding the definitive bottom can either put on substantial risk or have the portfolio sitting in limbo for quite some time slowly degrading the value of money. So, instead, invest in strategies that diversify the risk in a cost-efficient way. Strategies that utilise risk control and downside protection, as well as diversify across multiple asset classes and markets, will be key.
The decisions that investors make to their portfolios in 2020 will determine their path towards success for the next decade.
By Paul Sandhu, head of Multi-Assets Quant Solutions, APAC, at BNP Paribas Asset Management.


