(ATF) US stocks continue hitting all-time highs, while tens of millions of Americans are still struggling to recover from the biggest ever surge in unemployment since the Covid-19 pandemic hit earlier this year.
This divergence between Wall Street and Main Street becomes more apparent when we look past the largest stocks, which are the ones that have gained the most value so far this year, and see that most of the more numerous small-cap US stocks have fallen over the same period.
On this side the Pacific, we see that not only have Chinese stocks risen more than US stocks so far this year, but the recovery has been far more even, with smaller Chinese stocks performing far better this year than their American counterparts. These might be read as indicators that China’s economic recovery has been more robust and even, and provide hints to investors on which markets and segments have the strongest post-Covid profit potential.
To monitor year-to-date performance of US stocks, we look at the S&P 500 index, versus the S&P 600 index of small cap stocks. So far this year, the large cap 500 index is up nearly 10%, while the small cap 600 benchmark is down over 10%.
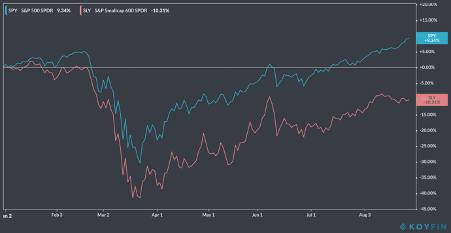
The outperformance of the 500 large stock portfolio (in blue in the graph here) over the 600 small stocks tracker (in red) looks even more dramatic when we see how much of the S&P 500’s return this year was due to just the five largest stocks: Facebook, Amazon, Microsoft, Alphabet (aka Google) and Apple, sometimes referred to by the acronym “FAMGA”. These five stocks currently make up almost 25% of the S&P 500’s capitalisation, and are up an average of over 57% since the start of the coronavirus outbreak, meaning even the other 495 stocks in the S&P 500 are, on average, down for the year.
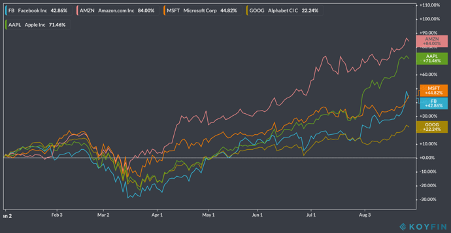
Graph 2: Stocks of Facebook (blue) are up 42.86% this year, with shares of Amazon (pink) up 84%, Microsoft (orange) up 44.8%, Goog/Alphabet (mustard) up 22.24% and Apple (green) up 71.5%.
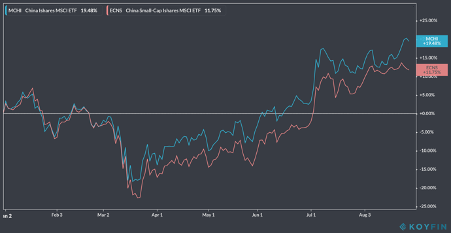
When we compare these returns to what happened to Chinese stocks over the same period, we see that smaller Chinese stocks outperformed the S&P 500 while lagging their large cap counterparts less in the offshore market, while in the onshore A-share market, small caps have risen more than large caps this year.
We track China’s “offshore” stock market through the MSCI China and MSCI China Small-Cap index ETFs, which mostly hold shares traded on Hong Kong and US exchanges. Although MSCI China is even more concentrated than the S&P 500, with 44% of market cap from China’s top six technology giants (JD.com, Alibaba, Baidu, Meituan Dianping, Netease, and Tencent), which perhaps could use an acronym like “JABMeNT”, the small-cap index has lagged by less than its US counterpart.
The first explanation I could find for this difference is the large weight of China’s small-cap index to the consumer discretionary sector, which have recovered quickly in the land of the Wuhan pool party, while the #1 sector in the S&P 600 is financials.
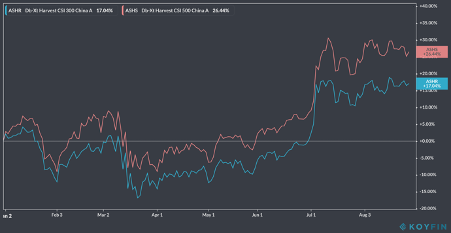
Looking to the Mainland at China’s Shanghai and Shenzhen listed A-shares, tracked by the large-cap CSI 300 index (blue) and the small-cap CSI 500 index (red), we see that prices of small-cap A-shares have outpaced A-share large caps. Again, much of this difference can be attributed to sector exposure: almost half of the CSI 500 is in information technology, health care and consumer sectors with only 5% in financials, while 28% of the CSI 300 is in financials.
While short-term price moves don’t usually mean much to long-term investors, these past eight months have “stress tested” global stocks to separate those who can continue to grow earnings after the pandemic, versus those who have struggled to keep up. And although sector differences explain much of the performance divergence of these six stock benchmarks, investors clearly seem willing to pay up more for a broader segment of the Chinese stock market than for US stocks smaller than the five largest ones. Add to this recent price momentum that MSCI China small-caps still trade at less than 10x earnings and 1.2x book value, while the S&P 500 trades at over 23x earnings and 3.6x book value, and US large caps seem poised for lower future returns with more risk than Chinese small caps.
The question for investors who think instead that US stocks will continue to outperform Chinese stocks is whether US stock performance will continue to be so dominated by the top few names, or whether the US can follow China’s lead of a more even recovery.
Tariq Dennison TEP runs GFM Group, a Hong Kong based cross-border wealth management firm. The views expressed here are his own.

This article references US-listed ETFs, which may not be suitable for residents of many Asian countries not covered by a comprehensive US tax treaty. Please consult with your own tax and investment advisers before making any investment decision.